| dvdisaster Version 0.64 (pl2) |
| To the Internet version | Deutsch English |
Figures: Error analysis |
 |
|
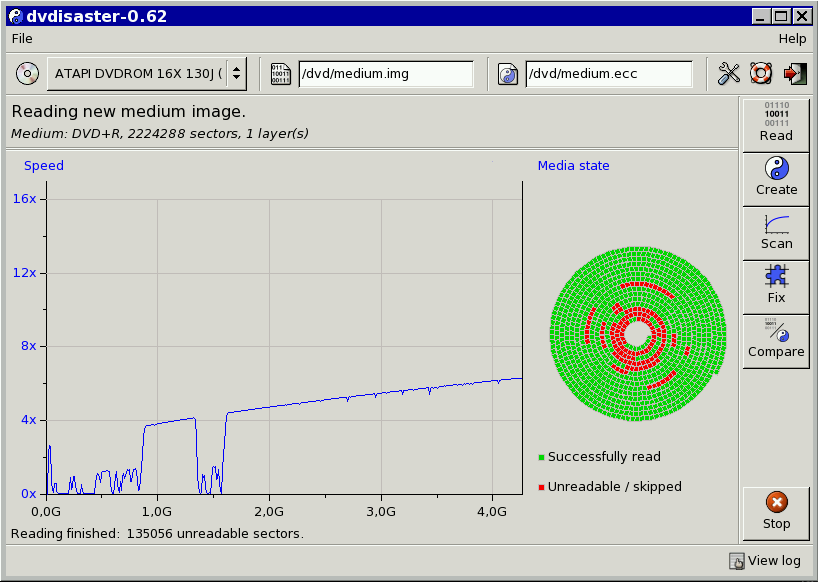
When reading or scanning media,
dvdisaster visualizes the reading speed (blue curve) and the number of read errors.
The spiral gives an estimate of the error distribution between the inner and outer
areas of the medium. However the spiral is not drawn to scale
since the exact angle between two segments does not resemble the situation on the real
medium for technical reasons.
|
 |
|
This chart shows how many errors have been corrected per error correction block, giving
an estimate of the working load of dvdisasters error correction.
The error graph does not correlate with the spatial arrangement of
read errors on the disc since the error correction method is explicitly built to
achieve an equal distribution of
medium read errors over all error correction blocks. Upto 32 read errors can be compensated per error correction block (green line) when the standard settings are used. Exceeding this line means that the medium contents can not be fully recovered. |
Back to the examples of error correction |
|
Copyright 2004,2005 Carsten Gnörlich. Verbatim copying and distribution of this entire article is permitted in any medium, provided this notice is preserved. |
|